News From The River
See the Latest Water Quality Monitoring Data from the FoRR Monitoring Team!
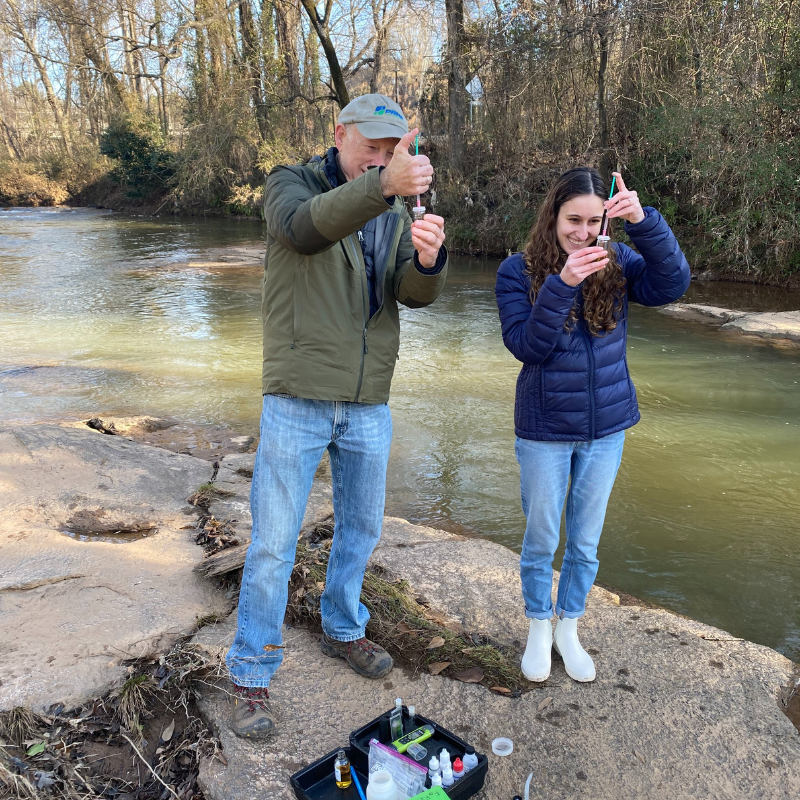
FoRR took to the river on January 11 and 16 to monitor at five sites along the Reedy River. Our sites include the following:
Site #1: Reedy River just downstream of Swamp Rabbit Cafe
Site #2: A small tributary of the Reedy River in Falls Park
Site #3: Reedy River on Mauldin Road upstream of ReWa's headquarters
Site #4: Reedy River on Greenville Tech's Brashier campus in Simpsonville
Site #5: Reedy River in Cedar Falls Park in Simpsonville
Stay tuned for opportunities to volunteer by sampling water quality through macroinvertebrate monitoring soon. We now have a macroinvertebrate monitoring kit available for SC Adopt-a-Stream certified macro volunteers!
The pH results for January were the same as or consistent with last month's findings for all sites, showing only small deviations from December’s results, if any.
The air and water temperatures for January’s sampling events were typical for this time of year, with an average air temperature of approximately 12℃ and average water temperature of about 9℃. The water temperatures at the Greenville sites were noticeably cooler due to the cold overnight temperatures in the week before sampling. We failed to collect water temperature data at the Falls Park site, but can estimate that the water temperature would have been about 7.25 based on the time of day during which it was sampled and the temperatures at the Greenville sites both up and downstream of this location. The water temperature at both Simpsonville sites was 11℃.
January’s dissolved oxygen (DO) sampling results ranged from 9.7mg/L at the Mauldin Road site upstream of ReWa’s headquarters, to 10.2mg/L at the site in Falls Park. The average overall DO for January was 9.96mg/L which is 1.18mg/L higher than December’s results and nearly double the average S.C. state standard of 5mg/L.
The Greenville sites had an average DO increase of 1.8mg/L from last month, but December’s readings were slightly low due to the warmer temperatures experienced during the week of sampling and the lack of consistently cool weather up to that point. The Simpsonville sites increased by an average of only 0.25mg/L from December’s sampling event but already had very high DO levels last month, so the lack of drastic increase was expected. January’s high DO levels can be attributed to the colder water temperatures (cold water has a higher capacity for more dissolved oxygen) and the slower metabolic rates of aquatic animal species like fish and aquatic macroinvertebrates whose activity levels slow during the winter months, leading to a lower utilization rate of the oxygen present in the water.
January’s E. coli bacteria results averaged 186.6cfu/100mL across all sites in the Greenville and Simpsonville areas. All results were well below the threshold of high bacteria (349cfu/100mL) per the SC State Standards with the highest E. coli count, 333cfu/100mL, being found at Falls Park and the lowest E. coli count, 67cfu/100mL, at the site near Swamp Rabbit Café. The Greenville sites decreased by an average of 111.33cfu/100mL, likely due to the dry conditions prior to sampling (the most recent rainfall was less than 1 inch) and the very cool water temperatures. Colder water is a less conducive environment for E. coli to thrive and multiply, so cooler water temperatures tend to correlate with lower E. coli levels. The average increase in E. coli bacteria counts at the Simpsonville sites was 83.5cfu/100mL. This is probably because of the close proximity of the sample date to a very significant rainfall of nearly 4 inches of rain over the course of 2 days from January 3 – 4, which resulted in substantial flooding. Because the Simpsonville sites are downstream of the urbanized downtown Greenville, their E. coli levels were most likely impacted by these heavy rains and the resulting floods. Overall, the E. coli levels for December were typical, if not low, for this time of year, and not cause for concern.
This month's results and the SC state standards are included for comparison below. All results were within state standards.
January 2023 Monitoring Results:
|